How to Use Heaven Benchmark, 3DMark and UserBenchmark
Introduction
Every gamer and hardware enthusiast eventually asks: “How powerful is my GPU, really?” The best way to find out is through GPU benchmark testing—a controlled stress test that measures real-world graphics and compute performance.
In this guide, the GPUBottleneckCalculator Lab breaks down three major graphics benchmark tools — Unigine Heaven benchmark, 3DMark, and UserBenchmark — explaining how to use them, what their scores mean, and which results actually reflect gaming reality.
Whether you’re testing a new GPU upgrade or troubleshooting throttling, this article shows how each GPU benchmark software behaves, where it excels, and where to be cautious.
Why GPU Benchmarking Matters
A GPU benchmark test simulates intensive gaming or rendering workloads to evaluate:
Frame rate (average FPS & 1% lows)
Thermal stability and clock behavior
Power consumption and efficiency
Comparative ranking across GPUs and driver versions
Benchmarks reveal whether your card performs as expected or if thermal throttling, driver issues, or background tasks are limiting it.
1. Unigine Heaven Benchmark — Classic Real-Time Rendering Test
What It Is
Unigine Heaven Benchmark is one of the oldest yet most consistent GPU benchmark tools, beloved for its detailed DirectX 11 stress test. It renders a steampunk city full of tessellation, shadows, and dynamic lighting.
Press F9 to start the benchmark; results appear after several scenes.
What to Look For
FPS: average frame rate shows GPU throughput.
Score: numeric summary for comparison.
Temperature: should remain under 85 °C.
Tip: Running the Heaven GPU Benchmark in a loop is ideal for checking cooler performance or verifying a stable overclock.
2. 3DMark — Industry-Standard Synthetic Benchmark
What It Is
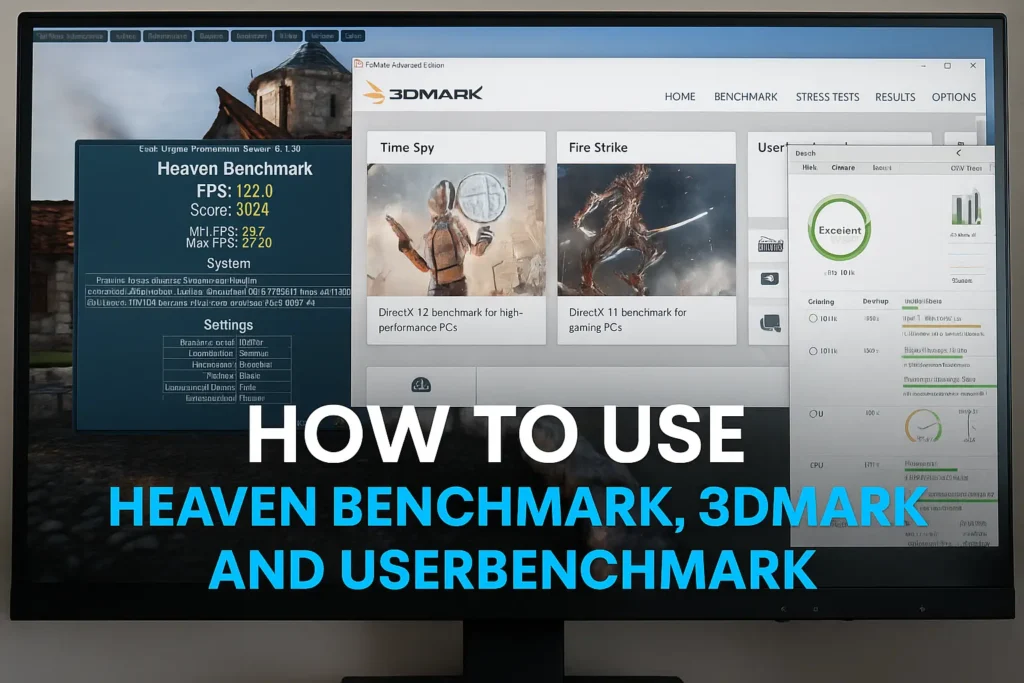
Developed by UL Benchmarks, 3DMark is the definitive video card benchmark suite used by reviewers worldwide. It contains multiple tests like Time Spy (DirectX 12), Fire Strike (DirectX 11), and Port Royal (ray tracing).
How to Use 3DMark to Test GPU
Install 3DMark from Steam or UL’s website (the basic version is a free GPU benchmark).
Choose a preset:
Time Spy for modern DX12 GPUs
Fire Strike for legacy DX11
Port Royal for ray-tracing hardware
Run the test → wait for the results window.
Compare your Graphics Score with similar cards online.
Understanding Scores
Graphics Score: GPU rendering power.
CPU Score: system’s multi-core scaling.
Combined Score: overall gaming balance.
A healthy system keeps GPU utilization near 100 % with stable temperatures below 83 °C. If scores are unusually low, check for driver issues or improper fan curves.
3. UserBenchmark — Fast but Controversial
What It Is
UserBenchmark is a browser-based GPU benchmark test and component comparator that provides an instant snapshot of performance versus other users.
How to Run It
Visit userbenchmark.com and click “Free Download.”
Close heavy apps, then run the tool.
Wait 1–2 minutes for CPU, GPU, SSD, and RAM tests.
Review the percentile chart for your GPU benchmark result.
Pros & Cons
Pros
Cons
Quick, simple, free
Heavily CPU-weighted scoring
Compares real user data
Inconsistent GPU metrics
Includes full system test
Alleged vendor bias (Intel/NVIDIA)
Many professionals recommend using 3DMark or Unigine Heaven benchmarks for accuracy and using UserBenchmark only for quick sanity checks.
Comparing the Three GPU Benchmark Tools
Feature
Heaven Benchmark
3DMark
UserBenchmark
Type
Real-time render
Synthetic suite
Mixed workload
GPU Stress
High (tessellation)
Very High (ray tracing, physics)
Low–Moderate
Duration
2–5 min
5–15 min
1–2 min
Cost
Free
Free + Paid
Free
Thermal Analysis
Excellent
Excellent
Limited
Community Comparisons
Manual
Automatic
Cloud database
If you need a free GPU benchmark, Heaven or 3DMark Basic are your best options. For serious validation, pair Heaven’s visuals with 3DMark’s numerical scoring.
Compare FPS and temps: stable curves = no thermal throttling.
Interpreting GPU Benchmark Results
Metric
Ideal Range
Meaning
Average FPS
> 60 fps
Smooth performance
1% Lows
> 45 fps
Frame-time stability
Max Temp
< 85 °C
Cooling efficiency
Score Deviation
< 5 %
Hardware health
If temperatures rise above 90 °C, revisit your fan curves and airflow — see our Fan Curves Guide for optimization.
Heaven Benchmark Download & Configuration Tips
Run windowed mode for monitoring tools (HWInfo, Afterburner).
Use “Extreme” tessellation to expose GPU limits.
Record min/avg/max FPS for comparative logs.
If testing laptops, limit thermal buildup with a cooling pad.
Pro Tip: Combine Tests for Full Picture
Use Heaven Benchmark for visual thermals.
Run 3DMark Time Spy for cross-system scoring.
Verify with UserBenchmark to detect SSD or RAM bottlenecks.
That tri-test workflow gives a balanced view of GPU performance, cooling, and stability.
Common Benchmarking Mistakes
Comparing across driver versions.
Running on integrated GPU by mistake.
Not resetting fan curves or case pressure settings.
Misinterpreting short-term FPS spikes as overall performance.
Verdict
3DMark and Heaven Benchmark remain the gold standard for GPU testing in 2026. UserBenchmark can be useful for quick comparisons, but its weighting model often underrepresents modern GPUs.
If you want consistent, trustworthy numbers:
👉 Use 3DMark Time Spy for synthetic performance. 👉 Run Unigine Heaven GPU Benchmark for real-time thermal and FPS testing. 👉 Cross-check with your own gameplay for validation.
Frequently Asked Questions
1. How to benchmark with Unigine Heaven?
Install the app, choose Ultra settings, run the benchmark (F9), and compare your Heaven Benchmark score with similar GPUs online.
2. How to use 3DMark to test GPU?
Open 3DMark → select Time Spy or Fire Strike → run test → compare the Graphics Score against the average for your card.
3. Is Unigine Heaven still a good benchmark?
Yes — while older, it remains a reliable graphics benchmark for DX11 load testing and cooler validation.
4. Why is UserBenchmark not using my GPU?
Check that Windows isn’t defaulting to integrated graphics. Ensure drivers and VGA benchmark software permissions are updated.
5. Why is my PC not using 100% of my GPU?
Background limits, frame-rate caps, or CPU bottlenecks can reduce utilization. Use a GPU benchmark test in fullscreen for accurate data.
6. Why shouldn’t you use UserBenchmark?
Many reviewers note bias toward certain brands and outdated scoring algorithms. Treat it as a quick check, not a definitive ranking.
7. What website is better than UserBenchmark?
Use 3DMark Browser, TechPowerUp GPU Database, or GPUBottleneckCalculator.com for verified performance comparisons.
8. Does benchmarking damage the CPU?
No, short tests are safe. Just monitor temps — benchmarks can hit 100 % load briefly, but CPUs are designed for it.
9. What is a good UserBenchmark score?
Scores > 80 % for GPU and > 90 % overall mean your system performs above average. Anything under 70 % suggests tuning or cooling issues.